15. 08. 2020.
Bypassing browser limits in WebAssembly debugging
Current state of WebAssembly debugging and tracing sets limits in browser on number of lines disassembled during debugging in development tools on both Firefox and Google Chrome based browsers. In case there is larger project than the limit imposed, browser only display disassembly up to the hardcoded limit. If you hit the problem you will identify it by having ;; .... text is truncated due to the size message on the end of the disassembly or just hit the limit without any message. What is the cause and is there any way to bypass it?
WebAssembly
By it's official web page and wikipedia, WebAssembly is an open standard that defines a portable binary-code format for executable programs, and a corresponding textual assembly language, as well as interfaces for facilitating interactions between such programs and their host environment. WebAssembly is designed to maintain the versionless, feature-tested, and backwards-compatible nature of the web. WebAssembly modules will be able to call into and out of the JavaScript context and access browser functionality through the same Web APIs accessible from JavaScript. WebAssembly also supports non-web embeddings.
Assessing security of the WebAssembly in browser depends on WebAssembly support in Developer tools. Both Chromium based browsers (like Google Chrome) and Mozilla Firefox have support for Web Assembly in similar fashion. That means you can debug and disassemble the WebAssembly directly from Developer tools or console.
WebAssembly debugging limits in browsers
If you hit large WebAssembly project, you could hit the limit imposed by the WASM support in Developer tools and consoles. You will notice the problem if you get following message on the end of the disassembly:
;; .... text is truncated due to the size
If you are not sure, you have problems with the limit, just scroll down to the end and you will get output similar to the following picture:
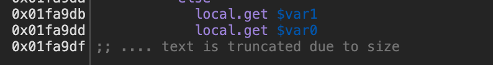 WASM limit in the browser
Interesting fact is that sometimes you just don't get the text that disassembly is truncated, but it only displays disassembly up to 1.000.000 lines without any additional notice. This is something I have hit in Google Chrome couple of times.
Since the problem was at the fixed line number and I could reproduce the problem each time, it was clear that there is some hard coded limit in the both browsers. Few hours later, wasm.js was identified as source for this specific action and there hard coded limit was identified. You can check yourself by going to the following URL with Mozilla Firefox (Chrome will not work):
resource://devtools/client/debugger/src/utils/wasm.js
Note that going with Chromium based browsers (including Google Chrome) will not work. Only Mozilla Firefox can display its resources via this way.
You will see the following hard coded limit in the browser:
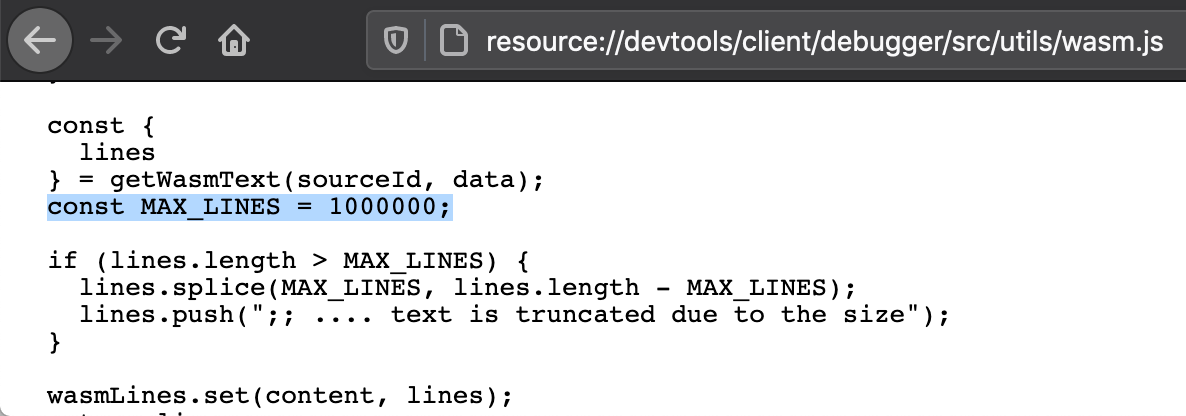 Firefox WASM limit
Constant MAX_LINES is hard coded in Developer Tools source and it limits disassembly to 1.000.000 lines. Of course, everything is working right until you reach the limit. Another interesting fact is that both Chromium based browser and Mozilla Firefox have same defined limit of 1.000.000 lines. There is claim that disassembly engine they are both using have problems with larger disassemblies than 1.000.000 lines, so they both set the same limit. I saw some development discussion where they plan to disassemble chunk by chunk, but I could not find any developments in that area.
Solution
Solution to this problem is actually to build new version of Developer Tools in case of Chromium based browsers and rebuilding the browser in case of Firefox. We have managed to bypass this limit in both browsers without problems. Also, we have produced patches which can help you in bypassing that limit and later in the section we provide instructions in building both Chromium and Firefox. We have limited the instructions on Linux, but there are links on building the browser for other platforms in the references. We have not tested each platform, but we could not identify any reason why it should not work on any other platform since we're changing only Javascript part.
Chromium and Google Chrome
Google Chrome or any browser based on Chromium does not require to recompile complete browser. Only rebuilding of developer tools (devtools) is needed. Also, browsers based on Chromium have nice option where you can specify your own path to the devtools with URL scheme, so you can have your own version locally or remotely.
Chromium is using gn for automating ninja builds and it is availble at the following URL:
https://gn.googlesource.com/gn
Get the gn and prepare all the directories
cd $HOME
mkdir src
cd src
Process for fetching the sources is straightfoward once gn and directories are ready:
git clone https://chromium.googlesource.com/chromium/tools/depot_tools.git
export PATH=$HOME/src/depot_tools:$PATH
fetch devtools-frontend
After fetching the needed tools, you can set your own limit. Patch example is here:
diff --git a/front_end/wasmparser_worker/WasmParserWorker.js b/front_end/wasmparser_worker/WasmParserWorker.js
index cd4a07eee..79b1742b9 100644
--- a/front_end/wasmparser_worker/WasmParserWorker.js
+++ b/front_end/wasmparser_worker/WasmParserWorker.js
@@ -125,7 +125,7 @@ self.onmessage = async function(event) {
   // memory in the worker (seems to work for the cases that we know about for now),
   // so we should look into using the chunked disassembly to implement this in a
   // more reasonable fashion.
-  const MAX_LINES = 1000 * 1000;
+  const MAX_LINES = 3000 * 1000;
   if (lines.length > MAX_LINES) {
     lines[MAX_LINES] = ';; .... text is truncated due to size';
     lines.splice(MAX_LINES + 1);
After changing the limit, you can start building devtools with the following commands:
gn gen out/Default
autoninja -C out/Default
after successful build, devtools are located in out/Default/resources/inspector and you can start chrome or chromium with following options:
chrome --custom-devtools-frontend=file://$(realpath out/Default/resources/inspector)
Also, it is possible to host these files on static web server and just reference them with --custom-devtools-frontend:
chrome --custom-devtools-frontend=http://localhost:8000/
Now, it is possible to use WASM debugger with your own defined limit in Chromium based browsers.
Mozilla Firefox
Mozilla Firefox does not have separate devtools as Chromium. So, rebuilding the whole browser is needed. Actually, there is shortcut where we can opt for Artifact Builds and build only Javascript part, so building the project is much faster.
Get the bootstrap and prepare all the directories
cd $HOME
mkdir src
cd src
wget https://hg.mozilla.org/mozilla-central/raw-file/default/python/mozboot/bin/bootstrap.py
By default you can run bootstrap and it will use mercurial(hg) for getting the source:
python3 bootstrap.py
cd mozilla-unified
Since we don't need to rebuild C/C++ part of the browser, but only javascript part, we can opt for Artifact Builds which are much faster. That means adding following lines to the .mozconfig file:
# Automatically download and use compiled C++ components:
# This option will disable C/C++ compilation
ac_add_options --enable-artifact-builds

# Write build artifacts to (not mandatory):
mk_add_options MOZ_OBJDIR=./objdir-frontend
Grab the patch from the firefox-wasm-limit repository and apply it:
wget https://raw.githubusercontent.com/Diverto/browser-wasm-limit/main/firefox-wasm-limit.diff
patch -p1 < firefox-wasm-limit.diff
After patch is applied, start the building the process:
./mach build
It will take some time to build the project, but after it is finished, you can run the newly built browser with following command:
./mach run
After you get the Mozilla Firefox window, you can type about:config in the URL in order to go to configuration section of the Firefox. There you can set advanced options and also new option where you can set custom limit of the lines as illustrated at the following picture:
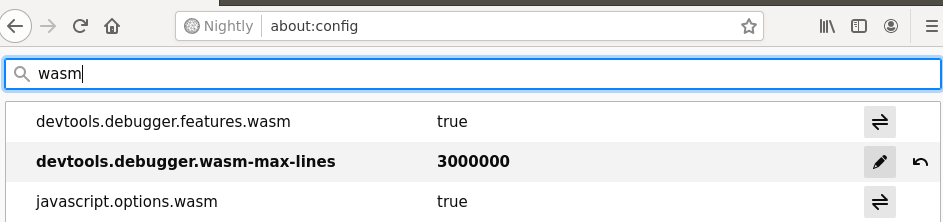 WASM configuration in Firefox
Set the limit to the desired one and you can work on the WebAssembly.
Summary
While WebAssembly is not new technology any more, there are still lot of space for improvements in tools for debugging, tracing and binary instrumentation. Especially if you are working on the larger projects. Lot of tools are not optimized or they are slow, so be patient and be ready for optimizations and patching if you work on any larger WebAssembly project. As with any other technology, it will take some time until tools are optimized and without such limits.
Tools
Tools mentioned in this article:
- browser-wasm-limit - patches to browser to change WASM limit
- gn - a meta-build system that generates build files for Ninja
- wabt - The WebAssembly Binary Toolkit
- wasabi - WebAssembly and instrumenting with Wasabi
- binaryen - compiler and toolchain infrastructure library for WebAssembly
- Wail - Javascript library for instrumenting WebAssemby binaries from within the browser
- Cetus - browser extension (Tested on Chrome and Firefox) for hacking WebAssembly